You are here:Home » Applications » How Liquid Chromatography Detects Sugars in Food
How Liquid Chromatography Detects Sugars in Food
Views: 707 Author: Yammi Publish Time: 2026-07-07 Origin: Site
Carbohydrates are one of the body’s most important sources of energy and are widely found in various foods. Carbohydrates share similar chemical structures, and traditional detection methods are often unable to accurately measure sugar content. High-performance liquid chromatography (HPLC) is the method of choice for detecting five common carbohydrates in food: fructose, glucose, sucrose, maltose, and lactose. This article will explain how HPLC detects carbohydrates in food, describe key analytical methods, and explain why it remains the standard analytical tool in modern food laboratories to this day.
What Are the Challenges in Carbohydrate Analysis?
The analysis and detection of carbohydrate compounds present multiple technical challenges, which is why traditional chemical methods are often inadequate.
1. High Structural Similarity Makes Separation Difficult
Fructose, glucose, sucrose, maltose, and lactose—commonly found in food—are all carbohydrates with highly similar molecular structures. Fructose and glucose are both monosaccharides with nearly identical molecular weights. Sucrose, maltose, and lactose are all disaccharides, but they are composed of different monosaccharide units linked by different glycosidic bonds. This high structural similarity results in very similar retention behavior when analyzed in the same chromatographic system. Achieving simultaneous baseline separation of these five sugars places high demands on the selectivity and resolution of the chromatographic column.
2. Lack of Characteristic UV Absorption
The molecular structures of the vast majority of sugars do not contain chromophores, resulting in extremely weak or even no response in conventional UV-visible detectors. This means that, unlike the direct quantitative analysis of food components such as vitamins and preservatives using UV detectors, special detectors or derivatization methods must be employed.
3. Complex Matrix Composition
Actual food samples often contain multiple interfering substances, such as proteins, fats, organic acids, and pigments. If sample preparation is improper, these co-existing components may contaminate the chromatographic column or elute simultaneously with the target sugars, severely affecting the accuracy of both qualitative and quantitative analysis.
Advantages of Liquid Chromatography for the Analysis of Sugars
In response to the challenges mentioned above, high-performance liquid chromatography (HPLC) offers a systematic solution, making it the preferred technique for sugar analysis.
1. Strong Separation Capability
HPLC uses high pressure to drive the mobile phase through a high-resolution column, enabling the individual separation of sugars with highly similar structures. It can achieve simultaneous baseline separation of five sugars—fructose, glucose, sucrose, maltose, and lactose—within a dozen or so minutes.
2. Flexible Detector Configuration
For compounds such as sugars that do not absorb UV light, HPLC systems can be configured with a refractive index detector (RID) or an evaporative light-scattering detector (ELSD). The refractive index detector responds by measuring the difference in refractive index between the mobile phase and the sample solution, providing a stable response signal for all sugars and offering simple operation. The evaporative light-scattering detector (ELSD), which operates through atomization, evaporation, and light scattering detection, offers higher sensitivity and is compatible with gradient elution. Both detectors have their own advantages and can be flexibly selected based on specific requirements.
3. Reliable Results
Liquid chromatography not only enables the qualitative identification of individual sugar components based on retention time but also allows for accurate quantification using either the external standard or internal standard methods. The linear correlation coefficient of the standard curve typically reaches 0.999 or higher, ensuring the reliability of quantitative results.
4. Wide Range of Applicable Samples
From clear beverages and fruit juices to viscous honey and syrups, as well as grain products and dairy products, liquid chromatography, when combined with appropriate pretreatment steps (dilution, extraction, filtration, etc.), can cover virtually all common food matrices.
How to Detect Fructose, Glucose, Sucrose, Maltose, and Lactose in Food
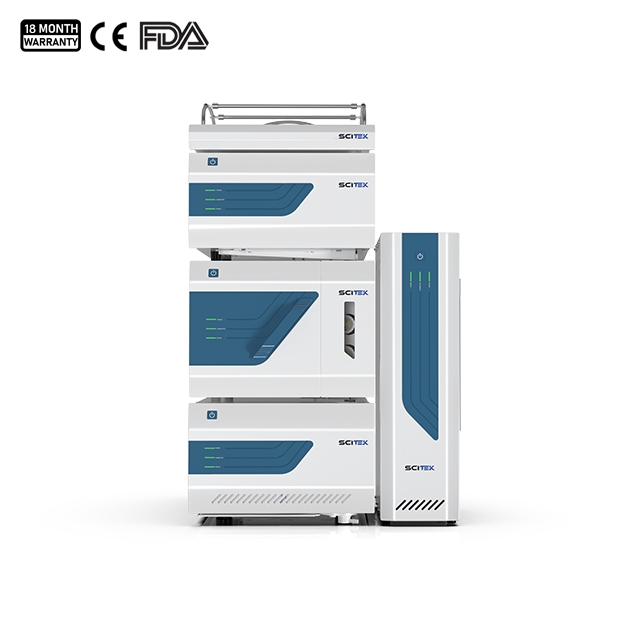
Determination of Fructose, Glucose, Sucrose, Maltose and Lactose in Food by LC-QGH3200Z Liquid Chromatography of Scitek. In this study, the Scitek LC-QGH3200Z HPLC system coupled with a refractive index detector was used to establish a method for the determination of the five sugars in food in accordance with the ISO 11292 and AOAC 982.14 international standard. The method was validated for system suitability, linearity, repeatability and applied to actual sample detection, providing a practical and efficient analytical solution for food testing laboratories, food manufacturers and regulatory authorities. The following is the complete procedure for determining these five sugars using liquid chromatography with a refractive index detector (RID).
1. Instrument Configuration
High-performance liquid chromatograph (HPLC) equipped with a binary high-pressure gradient pump or isocratic pump
Precision and Accuracy : 0.0001 mL/min, ±0.2%(1 mL/min)
2. Chromatographic Conditions
Parameter
Recommended Condition
Column
Amino (NH₂) column, 4.6 mm × 250 mm, 5 μm particle size
Mobile Phase
Acetonitrile : Water = 70 : 30 (v/v)
Flow Rate
1.0 mL/min
Column Temperature
40°C
Injection Volume
10 μL
Detector Temperature
40°C
Analysis Time
Approximately 20 min
Under these conditions, the five sugars elute in the following order: fructose → glucose → sucrose → maltose → lactose, with all peaks eluting within 16 minutes.
Prepare a mixed standard stock solution (20.0 mg/mL): Weigh approximately 1 g each of dried fructose (dried at 90 °C for 2 h), glucose, sucrose, maltose, and lactose (all dried at 96 °C for 2 h), accurate to 0.001 g. Dissolve in water and transfer to a 50 mL volumetric flask. Add 2.5 mL of acetonitrile and dilute to the mark with water. Store sealed at 0–4 °C; valid for 3 months.
Series of Standard Working Solutions: Pipette 0.100, 1.00, 2.00, 3.00, and 5.00 mL of the stock solution into separate 10-mL volumetric flasks. Dilute with water to the mark to obtain a series of standard solutions with concentrations of 0.200, 2.00, 4.00, 6.00, and 10.0 mg/mL.
5. Sample Preparation
Sample preparation methods vary slightly depending on the type of food:
Honey and syrups: Weigh 1–2 g of the sample, dissolve it in water, and make up the volume to 100 mL. Mix thoroughly, let stand, then collect the supernatant. Filter through a 0.45 μm microporous filter membrane before injection.
Beverages: Take the sample directly, degas it using an ultrasonicator, filter it through a 0.45 μm microporous filter membrane, and then inject it. If the concentration is too high, dilute it appropriately.
Dairy products and grain products: These require steps such as protein precipitation, fat removal, and extraction.
6. Results and Discussion
System Suitability
The mixed standard working solution was injected under the established method, and the chromatogram of the five sugars was obtained (Figure 1). Five sugars showed sharp and symmetrical chromatographic peaks with no overlapping peaks. The resolution between adjacent peaks was all greater than 1.5.
Figure 1. Chromatogram of fructose, glucose, sucrose, maltose and lactose
Analyte
Retention Time (min)
Peak Area
Theoretical Plate Number
Tailing Factor
Resolution
Fructose
7.852
207.159
6270
1.514
2.81
Glucose
9.081
145.505
5767
1.378
5.964
Sucrose
12.063
216.388
8559
1.356
4.117
Maltose
14.496
73.309
7710
1.224
1.986
Lactose
15.864
93.507
7811
1.427
-
Table 4. Chromatographic parameters for fructose, glucose, sucrose, maltose and lactose
Linearity
The standard curves were established with the concentration (mg/mL) as the abscissa (x) and the peak area as the ordinate (y), as shown in Figure 2. The correlation coefficients (R) of all five sugars were greater than 0.999, indicating an excellent linear relationship between the concentration and peak area in the range of 0.200 mg/mLto 10.0 mg/mL.
Figure 2. Curve equations and correlation coefficients for fructose, glucose, sucrose, maltose and lactose
Repeatability
The mixed standard working solution was injected 7 times under the same chromatographic conditions, and the retention time and peak area were recorded to calculate the relative standard deviation (RSD). The results are shown in Figure 3. and Table 5.
Figure 3. Repeatability Chromatograms of fructose, glucose, sucrose, maltose and lactose (n=7)
The RSD of retention time for all five sugars was less than 0.3%, and the RSD of peak area was less than 1.4%. The results show that the SCITEK LC-QGH3200Z HPLC system system has excellent precision and repeatability, with stable retention and consistent peak response, which can meet the requirements of routine repeated sample detection.
Sample
Fructose
Glucose
Sucrose
Maltose
Lactose
Retention Time
Peak Area
Retention Time
Peak Area
Retention Time
Peak Area
Retention Time
Peak Area
Retention Time
Peak Area
1
7.799
207.356
9.005
149.909
11.947
215.439
14.325
75.911
15.706
94.582
2
7.789
207.322
8.992
150.544
11.924
216.672
14.3
75.012
15.667
93.788
3
7.78
206.879
8.981
147.817
11.906
216.803
14.27
75.636
15.65
93.36
4
7.779
206.747
8.977
147.479
11.9
214.864
14.261
76.249
15.642
96.725
5
7.782
207.659
8.978
148.149
11.897
215.869
14.256
75.857
15.637
93.239
6
7.778
207.044
8.971
146.346
11.883
218.969
14.234
75.875
15.616
95.849
7
7.773
208.872
8.963
151.643
11.869
214.917
14.218
77.445
15.6
93.998
Average
7.783
207.411
8.981
148.841
11.904
216.219
14.266
75.998
15.645
94.506
RSD/%
0.108
0.345
0.153
1.272
0.215
0.664
0.257
0.976
0.221
1.395
Table 5. Chromatographic repeatability parameters for fructose, glucose, sucrose, maltose and lactose
Actual Sample Analysis
The established method was applied to the determination of sugar content in a commercial Loquat and Autumn Pear Syrup sample. The chromatogram of the sample is shown in Figure 4, and the detection results are shown in Table 6.
Figure 4. Chromatograms of commercial Loquat and Autumn Pear Syrup sample
Based on the results, the Loquat and Autumn Pear Syrup contains fructose, glucose, sucrose, and maltose, with concentrations of 5.719728 mg/mL, 6.583038 mg/mL, 0.120169 mg/mL, and 0.743335 mg/mL, respectively.
Analyte
Retention Time (min)
Peak Area
Peak Height
Theoretical Plate Number
Tailing Factor
Resolution
Concentration
Fructose
7.728
197.687
13.021
6217
1.463
2.72
5.719728 mg/mL
Glucose
8.892
148.75
8.347
5875
1.361
6.321
6.583038 mg/mL
Sucrose
11.769
4.649
0.287
11134
0.948
4.639
0.120169 mg/mL
Maltose
14.057
8.966
0.454
10822
0.783
n.a.
0.743335 mg/mL
Table 6. Chromatographic parameters for Loquat and Autumn Pear Syrup
Precautions for Chromatography Column Use
Amino-bonded columns are the most commonly used type of chromatography column in carbohydrate analysis, but the following precautions should be observed during use:
The acetonitrile content in the mobile phase should generally be at least 60%; otherwise, the amino-bonded phase is prone to hydrolysis and leaching, which shortens the column’s lifespan;
When the column is not in use for an extended period, it should be properly stored according to the manufacturer’s recommended solvent system;
Be sure to filter samples through a 0.45 μm filter membrane before injection to prevent particulate matter from clogging the column.
Common Issues and Troubleshooting
Peak tailing or splitting: This may be caused by column contamination or a decrease in column efficiency. The column can be regenerated by flushing with an appropriate solvent, or the guard column can be replaced.
Decreased resolution: Check whether the mobile phase ratios are correct, or whether the column has reached the end of its service life.
Baseline drift: The refractive index detector is sensitive to temperature. Ensure that the column oven and detector temperatures are stable, and that the mobile phase is thoroughly degassed.
Conclusion
High-performance liquid chromatography (HPLC), with its exceptional separation capabilities, flexible detector configurations, and well-established quantitative systems, has become the mainstream technique for the detection of sugars in food. Whether in terms of methodological maturity or the comprehensiveness of standards and regulations, the HPLC-RID/ELSD method stands up to rigorous scrutiny. For food manufacturers, mastering this method helps ensure precise control over product formulations and quality; for testing institutions, it serves as a vital technical foundation for ensuring food safety and protecting consumer health. With the continuous advancement of chromatography technology, the sensitivity, speed, and level of automation in carbohydrate analysis are expected to improve further.
As a professional lab and medical equipment manufacturer, Scitek Global is certified by ISO 9001, ISO 13485, ISO 45001 and ISO 14001. Almost all our products are certified by ETL, CE and FDA .
Scitek Global looks forward to establishing cooperation with more distributors all over the world, and working together to create greater customer value.

 English